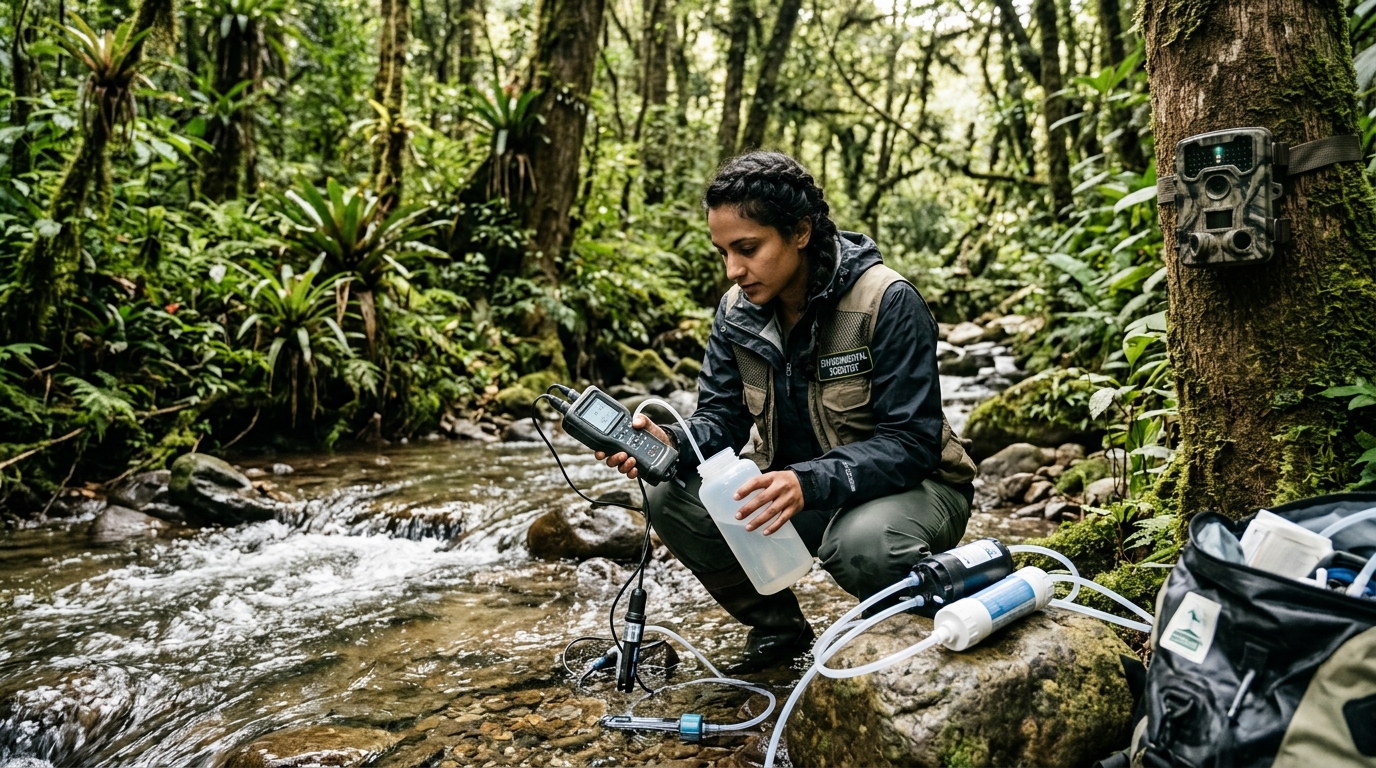
You cannot protect what you cannot measure. Ecological monitoring is the scientific foundation of modern conservation biology. From traditional taxonomic quadrat sampling and mathematical diversity indices to cutting-edge genomic environmental DNA (eDNA) metabarcoding and airborne LiDAR remote sensing, monitoring methodologies provide quantitative benchmarks to assess ecosystem health and verify conservation success.
For more than two centuries, biodiversity assessment was primarily a laborious, physical endeavor: naturalists traversed remote wildernesses with butterfly nets, plant presses, and binoculars, cataloging specimens one by one. While traditional field taxonomy remains the bedrock of natural history, the urgent pace of global environmental change has catalyzed a technological revolution in ecological measurement.
Today, conservation scientists integrate classical mathematical models with high-throughput molecular biology, passive acoustic sensors, and orbital satellite remote sensing. In this comprehensive guide, we dissect the mathematical formulation of diversity indices, evaluate sentinel bioindicator organisms, explore the molecular revolution of environmental DNA, and examine remote sensing frameworks that monitor Earth’s biosphere from space.
1. Mathematical Foundations: Quantifying Richness, Evenness, and Dominance
Ecologists rely on rigorous mathematical formulations to reduce complex biological communities into standardized, comparable numerical indices:
A. The Shannon-Wiener Diversity Index (H’)
Rooted in Claude Shannon’s mathematical theory of information, the Shannon-Wiener Index quantifies the degree of uncertainty in predicting the species identity of a random individual taken from a sample:
Where p_i represents the proportion of individuals belonging to the i-th species (n_i / N). Higher values of H’ (typically between 1.5 and 3.5 in natural communities) indicate high species richness and equitable evenness. A low H’ value signals a disturbed habitat dominated by one or two opportunistic weed species.
B. The Simpson Diversity Index (D and 1 – D)
The Simpson Index measures dominance—the probability that two individuals randomly selected from a community belong to the exact same species:
As dominance increases (one species monopolizes the ecosystem), D approaches 1. Conversely, Simpson’s Index of Diversity (1 – D) ranges from 0 to 1, where values approaching 1 reflect highly diverse, well-balanced ecosystems.
2. Sentinel Bioindicator Taxa: Living Canary in the Coal Mine
Measuring every chemical contaminant or tracking every microscopic organism across a landscape is practically impossible. Instead, ecologists monitor bioindicator species—organisms whose physiological sensitivity, population trends, or behavioral changes provide early warnings of environmental degradation:
- Amphibians (Freshwater and Terrestrial Sentinels): Frogs, toads, and salamanders possess highly permeable skin and gelatinous shell-less eggs that readily absorb waterborne toxins and airborne pollutants. Their dual aquatic-terrestrial lifecycle exposes them to stresses in both environments, making amphibian population declines the primary early alarm for chemical contamination and fungal pathogens (such as Batrachochytrium dendrobatidis).
- Benthic Macroinvertebrates (River Health Indicators): In freshwater biomonitoring, scientists sample bottom-dwelling insects using the EPT Index (Ephemeroptera: mayflies, Plecoptera: stoneflies, Trichoptera: caddisflies). These three insect orders require cold, clean, highly oxygenated water and cannot tolerate sediment or chemical pollution. If a river sample lacks EPT taxa and contains only pollution-tolerant bloodworms (chironomids) and sludge worms (Tubifex), severe organic pollution is confirmed.
- Epiphytic Lichens (Air Quality Monitors): Because lichens lack roots and protective cuticles, they absorb moisture and nutrients directly from the air. Species like Usnea (beard lichens) are hypersensitive to sulfur dioxide (SO2) and nitrogen oxides; their absence from tree bark indicates industrial atmospheric pollution.
3. The Molecular Revolution: Environmental DNA (eDNA) Metabarcoding
One of the most revolutionary breakthroughs in 21st-century conservation science is environmental DNA (eDNA). Every living organism continuously sheds cellular material into its environment—sloughed skin cells, mucus, scales, hair, urine, feces, and decomposing tissue—leaving a microscopic genomic footprint in the water, soil, and air.
By simply scooping a one-liter bottle of water from a river or ocean, filtering the suspended particulate matter, extracting cellular DNA, and running high-throughput next-generation sequencing (NGS) targeting standard barcode genes (such as 12S rRNA for vertebrates or COI for invertebrates), scientists can simultaneously detect the presence of hundreds of cryptic, rare, or elusive species without ever seeing, netting, or disturbing a single animal.
Comparison: Traditional Surveys vs. eDNA Metabarcoding
4. Satellite Remote Sensing and Bioacoustic Monitoring
To scale biodiversity monitoring to continental dimensions, conservationists integrate space-borne sensors and autonomous field robotics:
- Airborne LiDAR (Light Detection and Ranging): Aircraft and drones emit millions of laser pulses per second to penetrate forest canopies, mapping the three-dimensional structural complexity of forests down to the centimeter. This structural complexity correlates directly with canopy bird and insect diversity.
- Satellite Multi-Spectral Imaging (NDVI): Satellites like Sentinel-2 and Landsat calculate the Normalized Difference Vegetation Index (NDVI), tracking chlorophyll activity, seasonal phenology, and illegal deforestation in near real-time across the globe.
- Passive Acoustic Monitoring (PAM): Solar-powered audio recorders deployed in remote rainforests record soundscapes 24/7. Machine learning algorithms (convolutional neural networks) automatically scan thousands of hours of audio, identifying specific bird, bat, and frog calls to track population densities continuously.
5. Frequently Asked Questions (FAQs)
Q1: How long does eDNA persist in a river or lake?
In aquatic environments, free eDNA is degraded by ultraviolet radiation, microbial consumption, and enzymatic nucleases within 1 to 2 weeks. This short persistence is an advantage because finding positive eDNA confirms that the animal was physically present in the water system very recently, rather than being an ancient artifact.
Q2: What is the EPT index in water quality testing?
The EPT index calculates the percentage of benthic aquatic insects belonging to three pollution-intolerant orders: Ephemeroptera (mayflies), Plecoptera (stoneflies), and Trichoptera (caddisflies). A high EPT percentage confirms clean, well-oxygenated water, while low percentages signal toxic chemical runoff or organic enrichment.
Q3: Can acoustic monitoring identify species that do not vocalize?
No. Passive acoustic monitoring relies strictly on sound production (vocalizations, echolocation, or wing vibrations). For silent organisms like reptiles, plants, or silent invertebrates, researchers combine acoustics with camera traps, eDNA, and physical quadrats to achieve a comprehensive biological census.
Modern biodiversity monitoring has evolved into a high-tech multidisciplinary science. By fusing mathematical diversity indices, sentinel bioindicator tracking, environmental DNA metabarcoding, and satellite remote sensing, conservationists can diagnose ecosystem health, detect declines before extinctions occur, and guide planetary ecological restoration.
6. Camera Traps and AI-Powered Computer Vision in Wildlife Censuses
Passive infrared (PIR) camera traps have transformed vertebrate wildlife monitoring from an invasive, stressful endeavor into a non-invasive, continuous observational science. Deployed along game trails, mineral licks, and waterholes, camera traps record high-resolution photographs and videos whenever a warm-bodied animal breaks the infrared beam:
- Individual Recognition via Unique Coat Patterns: In species with distinctive markings—such as tigers (stripes), leopards and jaguars (rosettes), giraffes (spot geometry), and zebras—computer vision algorithms automatically match photographed animals against global databases, generating precise mark-recapture population estimates without physically capturing or tranquilizing a single animal.
- Spatially Explicit Capture-Recapture (SECR) Models: By mathematically integrating camera trap grid locations, animal detection probabilities, and home range movements, SECR models calculate absolute animal densities and reveal landscape movement corridors.
- Artificial Intelligence Sorting: Camera traps generate millions of photographs, the vast majority triggered by blowing vegetation. Deep learning convolutional neural networks (such as Microsoft’s MegaDetector) automatically filter out empty frames and classify animal species with over 98% accuracy, saving researchers thousands of hours of manual review.
7. Spatial Conservation Prioritization: Systematic Conservation Planning (SCP)
Collecting biodiversity data is only useful if it informs real-world policy. Conservation scientists employ Systematic Conservation Planning (SCP) software packages (such as Marxan and Zonation) to optimize protected area networks:
By inputting spatial layers of eDNA detections, camera trap occupancy, satellite NDVI, topography, and land acquisition costs, SCP algorithms calculate the exact reserve configurations that protect the maximum number of endangered species while minimizing conflict with human agriculture and infrastructure.
9. Global Comparative Case Studies and Field Methodologies
Scientific exploration of Measuring and Monitoring Biodiversity: Bioindicators, Environmental DNA (eDNA), and Ecological Indices requires examining long-term empirical field data across diverse continents. Over the past five decades, ecological research stations—such as the Smithsonian Tropical Research Institute, the Long Term Ecological Research (LTER) network, and the European FluxNet system—have gathered millions of quantitative data points that demonstrate how microclimates, species interactions, and human pressures reshape habitat integrity over time.
Standardized field methodologies involve combining permanent forest dynamic plots (typically 50-hectare research quadrats where every tree exceeding 1 cm in diameter is tagged, mapped, and monitored) with eddy covariance flux towers. These towers rise high above forest canopies, measuring the continuous net ecosystem exchange (NEE) of carbon dioxide, water vapor, and heat fluxes between vegetation and the atmosphere at 20-millisecond frequencies, providing absolute empirical confirmation of planetary climate buffering.
Quantitative Field Metrics and Monitoring Parameters
10. Multilateral Policy Frameworks and 2030 Sustainable Development Goals
Preserving the integrity of Measuring and Monitoring Biodiversity: Bioindicators, Environmental DNA (eDNA), and Ecological Indices is intrinsically linked to achieving the United Nations 2030 Sustainable Development Goals (SDGs), particularly SDG 13 (Climate Action), SDG 14 (Life Below Water), and SDG 15 (Life on Land). International conventions, including the Convention on Biological Diversity (CBD) and the United Nations Framework Convention on Climate Change (UNFCCC), now mandate that national ecological action plans formally account for ecosystem services within gross domestic accounting systems.
Furthermore, the emergence of the Taskforce on Nature-related Financial Disclosures (TNFD) is revolutionizing corporate environmental responsibility. Multinational financial institutions and corporations are now legally required to assess, disclose, and actively mitigate their physical supply chain dependencies on wild ecosystems. By aligning private capital allocation with ecological regeneration, humanity is establishing the financial foundations necessary to ensure long-term evolutionary equilibrium across all global biomes.
Addressing the challenges outlined in ‘Measuring and Monitoring Biodiversity: Bioindicators, Environmental DNA (eDNA), and Ecological Indices’ demands a unified three-tiered approach: (1) Immediate legal moratoriums on industrial land conversion in primary frontier wildernesses; (2) Sovereign debt restructuring through debt-for-nature swaps that empower local conservation trusts; and (3) Scaling high-integrity biodiversity credits that directly fund local Indigenous communities and frontline conservation stewards.
In addition to technological monitoring and multilateral treaties, grassroots environmental education serves as the vital cultural catalyst for enduring change. When local communities and academic institutions establish participatory citizen-science observatories, community members actively participate in biodiversity monitoring, water chemistry sampling, and phenological tracking. This democratic approach to scientific discovery transforms local populations from passive observers into passionate, empowered guardians of their ancestral natural heritage.
As we navigate the ecological challenges of the Anthropocene, the choice before humanity is clear: we can continue the trajectory of short-sighted industrial exploitation that destabilizes our planet’s life-support machinery, or we can embrace a profound ecological renaissance rooted in scientific rigor, Indigenous wisdom, and restorative environmental ethics. By protecting intact habitats, restoring degraded landscapes, and honoring the intricate ecological networks that bind all living creatures, we secure a flourishing, biodiverse Earth for generations to come.